Analysing Attendance Times
Attendance times can be analysed to show distribution of attendance times for the 1st and 2nd appliance at the scene.
This analysis can be done on historic data or the output of a model.
Select Attendance from the toolbar. dialog")
Standard Attendance Time Analysis
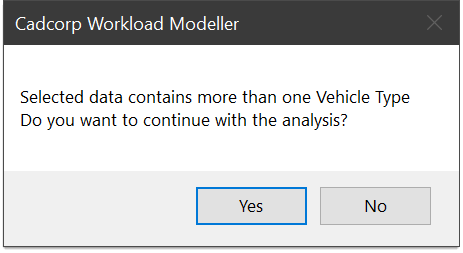
Standard Analysis considers the first two appliances to arrive at an incident within the filtered dataset. Because different vehicle classes can have different "In Attendance" targets, you will be alerted if the analysed data contains more than one vehicle class.
For instance, in an analysis of 1st and 2nd ‘pumps’ arriving at incidents the filter should be set to include ‘pumps’ only.
The output below shows that for 25 incidents in the analysis, the 1st appliance arrived in between eight and nine minutes, for 32 incidents the 1st appliance arrived in between thirteen and fourteen minutes etc.
Select  to create an Excel workbook for this output. This workbook will contain:
- A title page which includes the date, time, table selection and filter definitions;
- A results spreadsheet of the numbers as they appear in the on-screen output;
- Three sheets with bar charts of the 1st and 2nd Appliance and the Lag time (the time between the 1st and 2nd appliance arrival) in minutes.
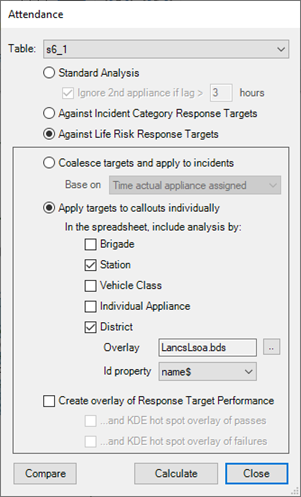
You can also analyse attendance Against Incident / Life Risk Category Response Targets (this requires response targets set in the database) or Against Life Risk Response targets.
Listed below are the various options you can select when analysing attendance times.
Coalesce targets
Targets can be coalesced and applied to incidents in the other two analysis options (Against Incident Category and Against Life Risk).
Coalesce - An incident ‘passes’ only if all the targets relevant to that incident are passed. Workbook comparison also supports this.
Therefore the first and subsequent vehicles must have passed the response target to be a total pass for the incident being successfully handled.
This is not applicable if one vehicle arrives at the incident and the others do not arrive in the response target time.
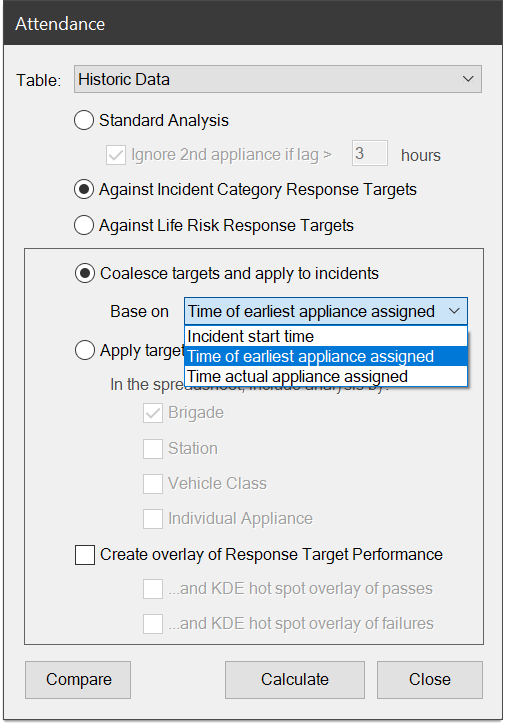
TIP: The pass time for each vehicle is calculated from the mobilisation data where the user has the choice to model from incident start time (so approximate ITN routecost + reaction time), or the time the earliest vehicle is assigned, or the actual appliance assigned (i.e. mobilised).
Select the Coalesce target to be applied to incidents based on:
- Incident start time
- Time of earliest appliance assigned
- Time of actual appliance assigned

Apply targets to Callouts individually
Attendance analysis can be broken down by individual targets like Station, Vehicle class and so on. The data for this analysis comes from:
- tblLifeRiskResponseTimes for life risk, based on
- tblIncidentResponseTimes for incident category
- Results show total callouts, in target and percentage
- The null value indicates a category that is not ‘Primary’/’Secondary’ (i.e.it is not a category in the database)
In this example we will see analysis applied by Districts.
To use this option, select an overlay of districts (e.g. station grounds, wards, super output areas etc) and the property containing the districts’ unique id.
TIP: All other options are concerned with the services performance (e.g. outgoing to incidents) while District collates benchmark performance within spatial areas (e.g. incoming performance.)
Response-Based Analysis
Response-based analysis can be performed on targets defined for Incident Categories or Life Risks. The figure below shows output where the following targets were set:
- ‘Primary’ incident types – the 1st appliance should arrive within 5 minutes;
- ‘Primary’ incident types – any 2nd or 3rd appliance should arrive within 10 minutes;
- ‘Secondary’ incident types – the 1st appliance should arrive within 20 minutes;

In the above example, the performance of the 1st appliance arriving for Primary incident types measured against the 5 minute target was 47%.
The ‘null’ row shows how many incidents in the analysis fell outside the categories of ‘Primary’ and ‘Secondary’.
An overlay of the full Life Risk analysis can also be created by enabling the Response Target Performance options on the Attendance form. 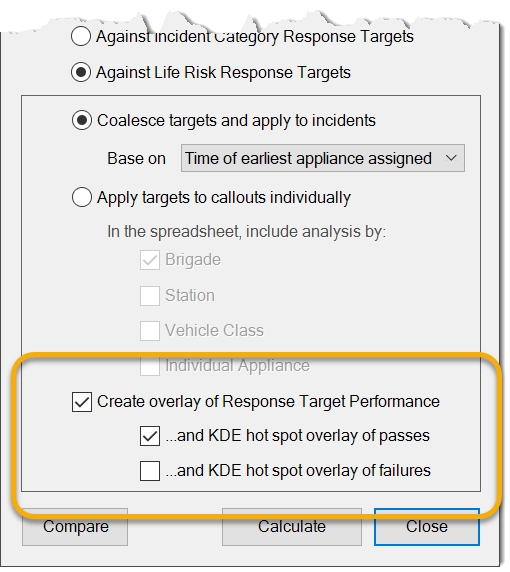
An example is shown below.

Hot Spot Maps
You have the option of creating KDE hotspot overlays with predefined parameters; this option is included in the Incident Category Response Targets and Life Risk Response Targets to improve visualisation.

Selecting all three options:
- Create overlay of Response Target Performance
- ... and KDE hot spot overlay of passes
- ... and KDE hot spot overlay of failures
creates these overlays:


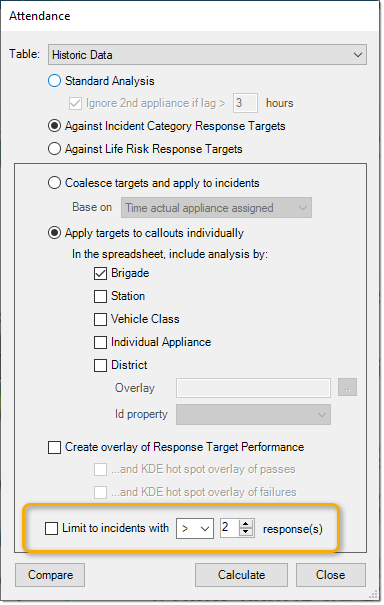
Limit Incidents
Attendance analysis can be narrowed down to specific scenarios. (For example to get performance targets exclusively for incidents where more than 1 appliance has attended).